Mogul

Validate Your Experimental or Predicted Structures Using Experimentally-Derived, Peer-Reviewed Data
Get a rapid, accurate assessment of molecular conformations in the context of millions of experimental observations in multiple scenarios such as:
- Small molecule structure validation
- Protein–ligand docking pose assessment
- Structure design.
Conduct a swift risk assessment of the conformation, and hence either the confidence to move ahead to the next stage of structural analysis, design, or development, or the warning flag that you may need to go back a step and review your docking, structure refinement, or structural design approach.
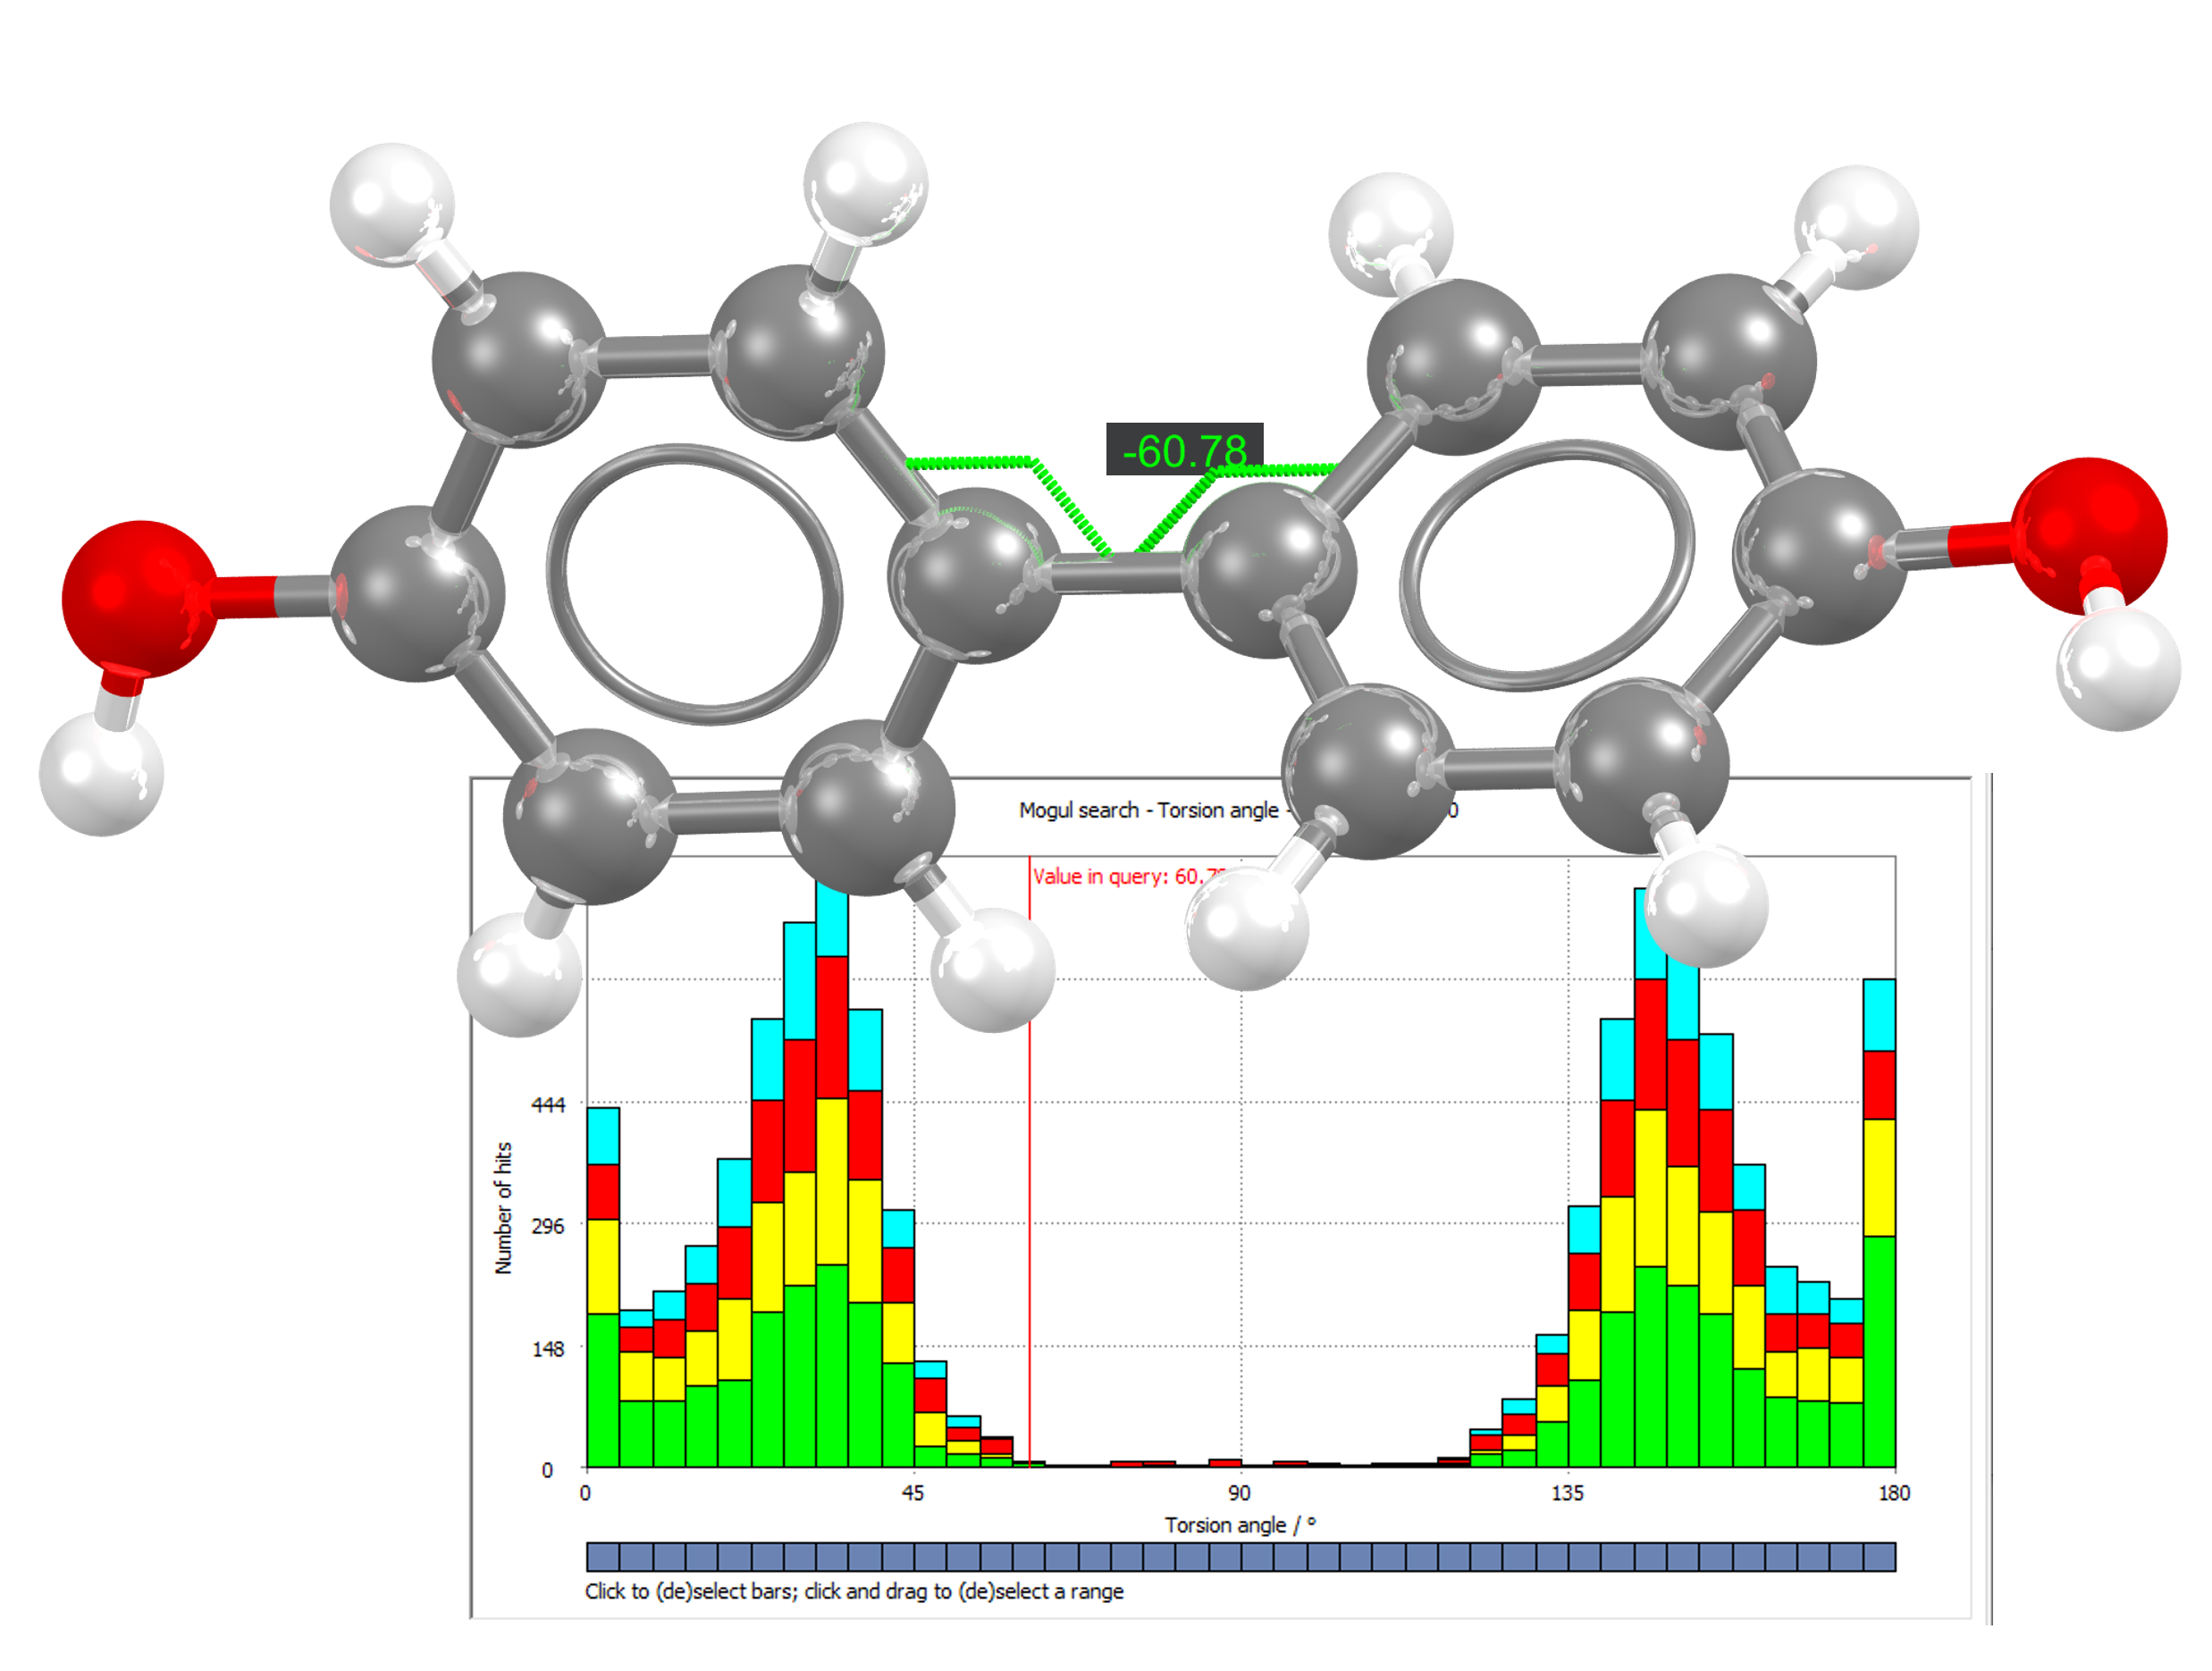
Mogul derives the quality of intramolecular geometries and can display distributions of important geometries based on the bond lengths, angles, ring geometries, and torsions of the expertly curated structures in the Cambridge Structural Database (CSD).
Benefits of Using Mogul to Validate Your Structures


View Distribution of Molecular Geometries in the Cambridge Structural Database
Build confidence in your structures by quickly identifying any unusual features, like torsions.

Drill into Each of the Individual Structures Behind a Distribution
Develop a deep understanding of your structure with quick access to each experimentally derived, peer-reviewed structure that is behind an analysis.

Visually Display the Distribution of the Geometrical Features in Easy-to-Read, Sharable Histograms
Compare observed features in your structure to averages found in the CSD. Have confidence in your results, which are based on up to 10,000 randomized structures from the CSD. Leverage the latest data in your analysis with the Mogul library, which is updated quarterly.
Focus on the Individual Features of a Molecule or Generate Reports on Your Whole Structure
Tailor your analysis to a general or targeted review based on your research goals.

Colour Code Potentially Concerning Features for Further Analysis
Understand what parts of the structure are unusual at a glance.

Run Reports Programmatically via the CSD Python API or Use CCDC's Mercury or Hermes Visualization Tools
Assess the quality of intramolecular geometries as part of a standard workflow or run custom checks.
Included in
Fields
Use Cases
Questions from the Computational Chemistry Community
See our complete technical FAQs in our knowledgebase.
FAQs
Only if you are an established CCDC Research Partner. Contact us to discuss if this is a requirement.
Mogul uses “local density” to quantify the unusualness of torsion angles. Specifically, this refers to the percentage of observed values within a user-defined tolerance. By default, Mogul will classify as “unusual” any torsion angles where less than 5% of the distribution is within 10 degrees of the query value. This is different from the statistical approach to quantify unusualness for bond lengths and covalent bond angles, which uses the | z-score |. | z-score | is the number of standard deviations from the mean. As a standard, it uses a threshold of 2.0—meaning any bonds or angles with a z-score greater than 2.0 are classed as unusual.
Mogul has the ability to complete a generalized search for any related fragments if there are not enough hits to match the exact query fragment in question. You can configure the generalization settings, which allows you to decide if the results from a generalized search are applicable to your particular chemistry.
You are able to drill down into each report to see the individual structures driving the results. In addition, the exact number of structures that went into each report is provided and can include up to 10,000 experimentally derived and peer-reviewed structures housed in the CSD.
Yes – Mogul accepts Crystallographic Information Files (CIFs), MOL2, PDB, RES, MOL, and .con (ConQuest 2D chemical diagrams) file formats as inputs. There is also a draw function that generates a histogram with hits based on the structure you specified. However, drawn structures do not have an input conformation to check against the data. Mogul cannot identify unusual or usual geometries for drawn molecules since they do not have a 3D geometry to assess.